Game Debugger and Profiler
The Debugger is a tool that lets you inspect the contents of your game. Allowing you to inspect the global variables, scene variables, and variables of instances of your objects. You can pause the game at any time, and check to see why something isn't working as intended or to do quick tests in your game.
The Profiler is a tool that measures the time spent on different aspects of your game while it is running. It helps to find bottlenecks between your events and the rendering of the game that could be taking up a lot of resources. Read more about using the profiler here!
Note
This is an advanced feature of GDevelop. If you use it, we would like you to show your support for GDevelop by getting a subscription!
Launch the debugger
To launch the debugger, in the toolbar of a scene editor, click on the arrow beside the preview button to bring up a drop-down menu. In that menu, choose "Preview with debugger and performance profiler".

This will open a new tab called "Debugger" and will also launch a preview of your game as usual.
Note that even if you close the preview, you can let the debugger tab stay unclosed. This way, any preview that you launch (with the usual Preview button) will be connected to the debugger.
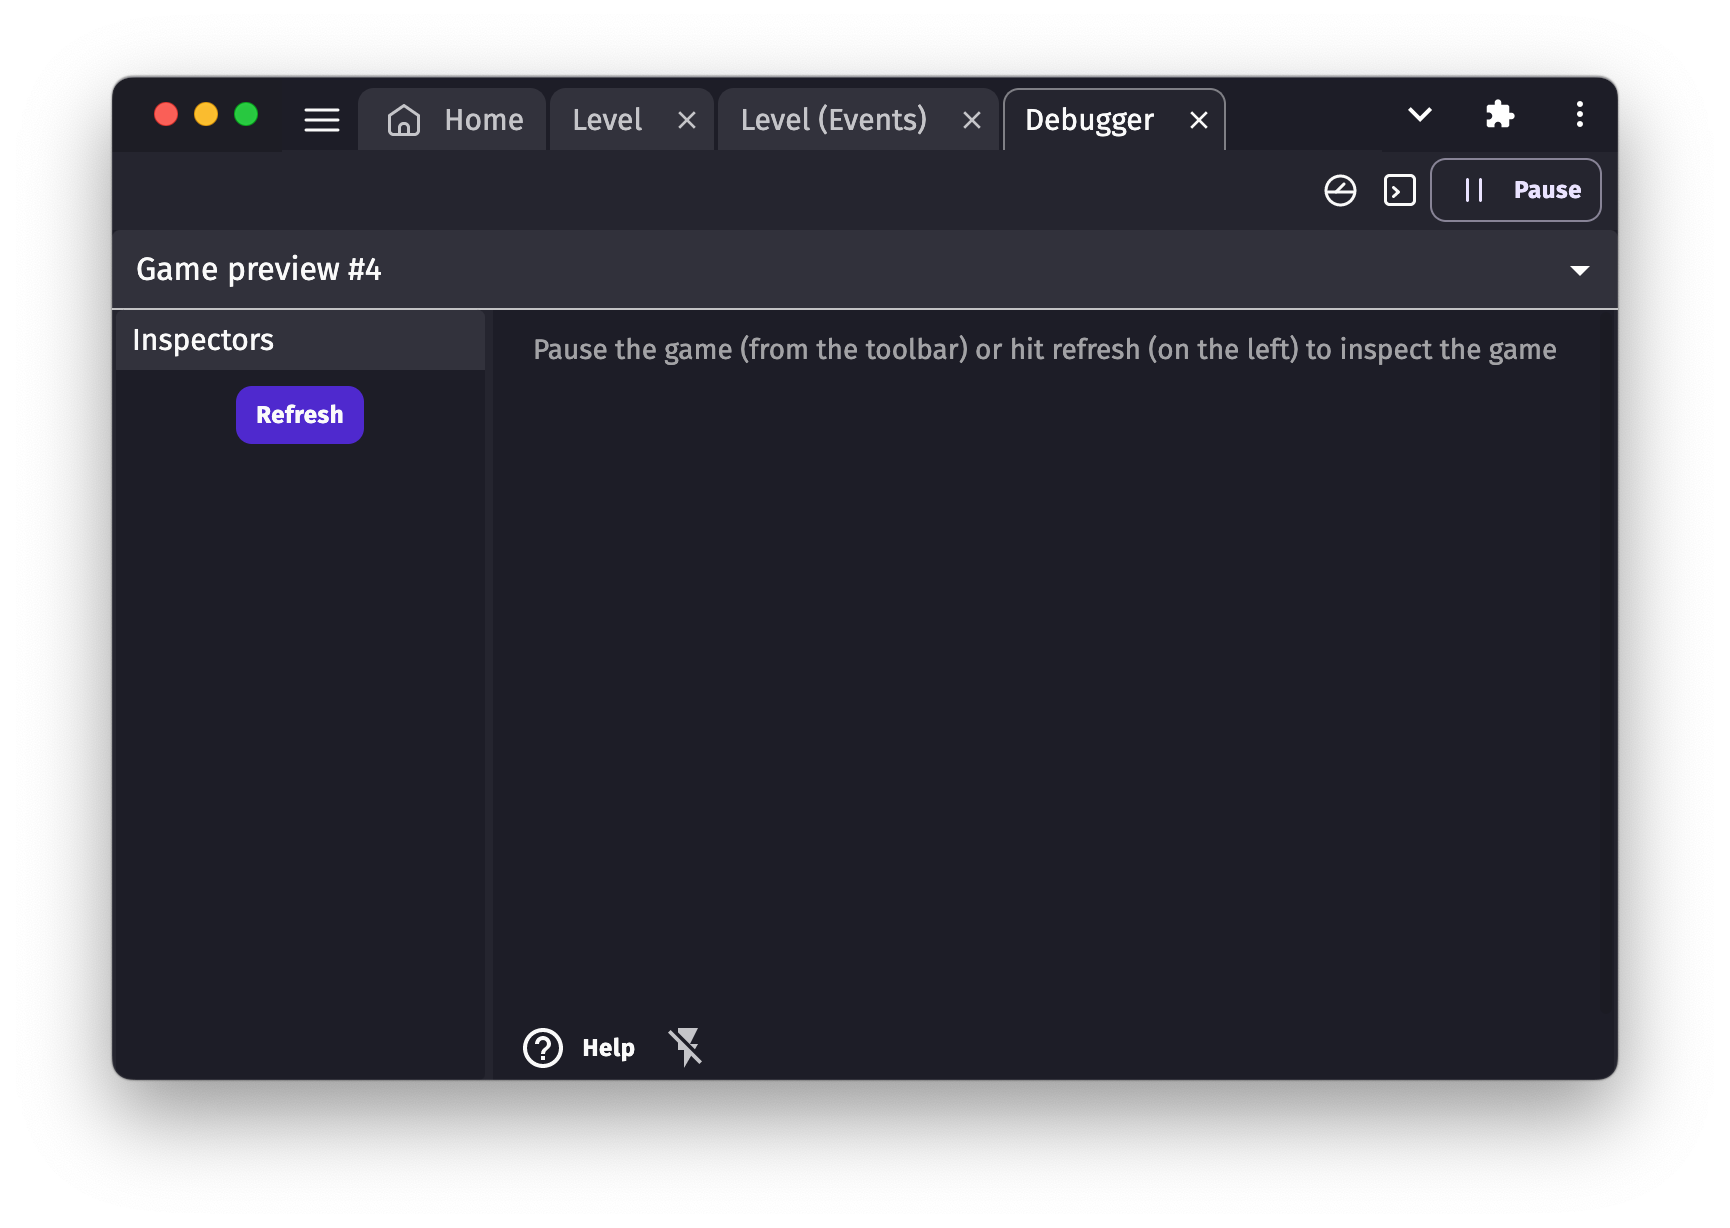
When the game is first launched, the debugger is empty:
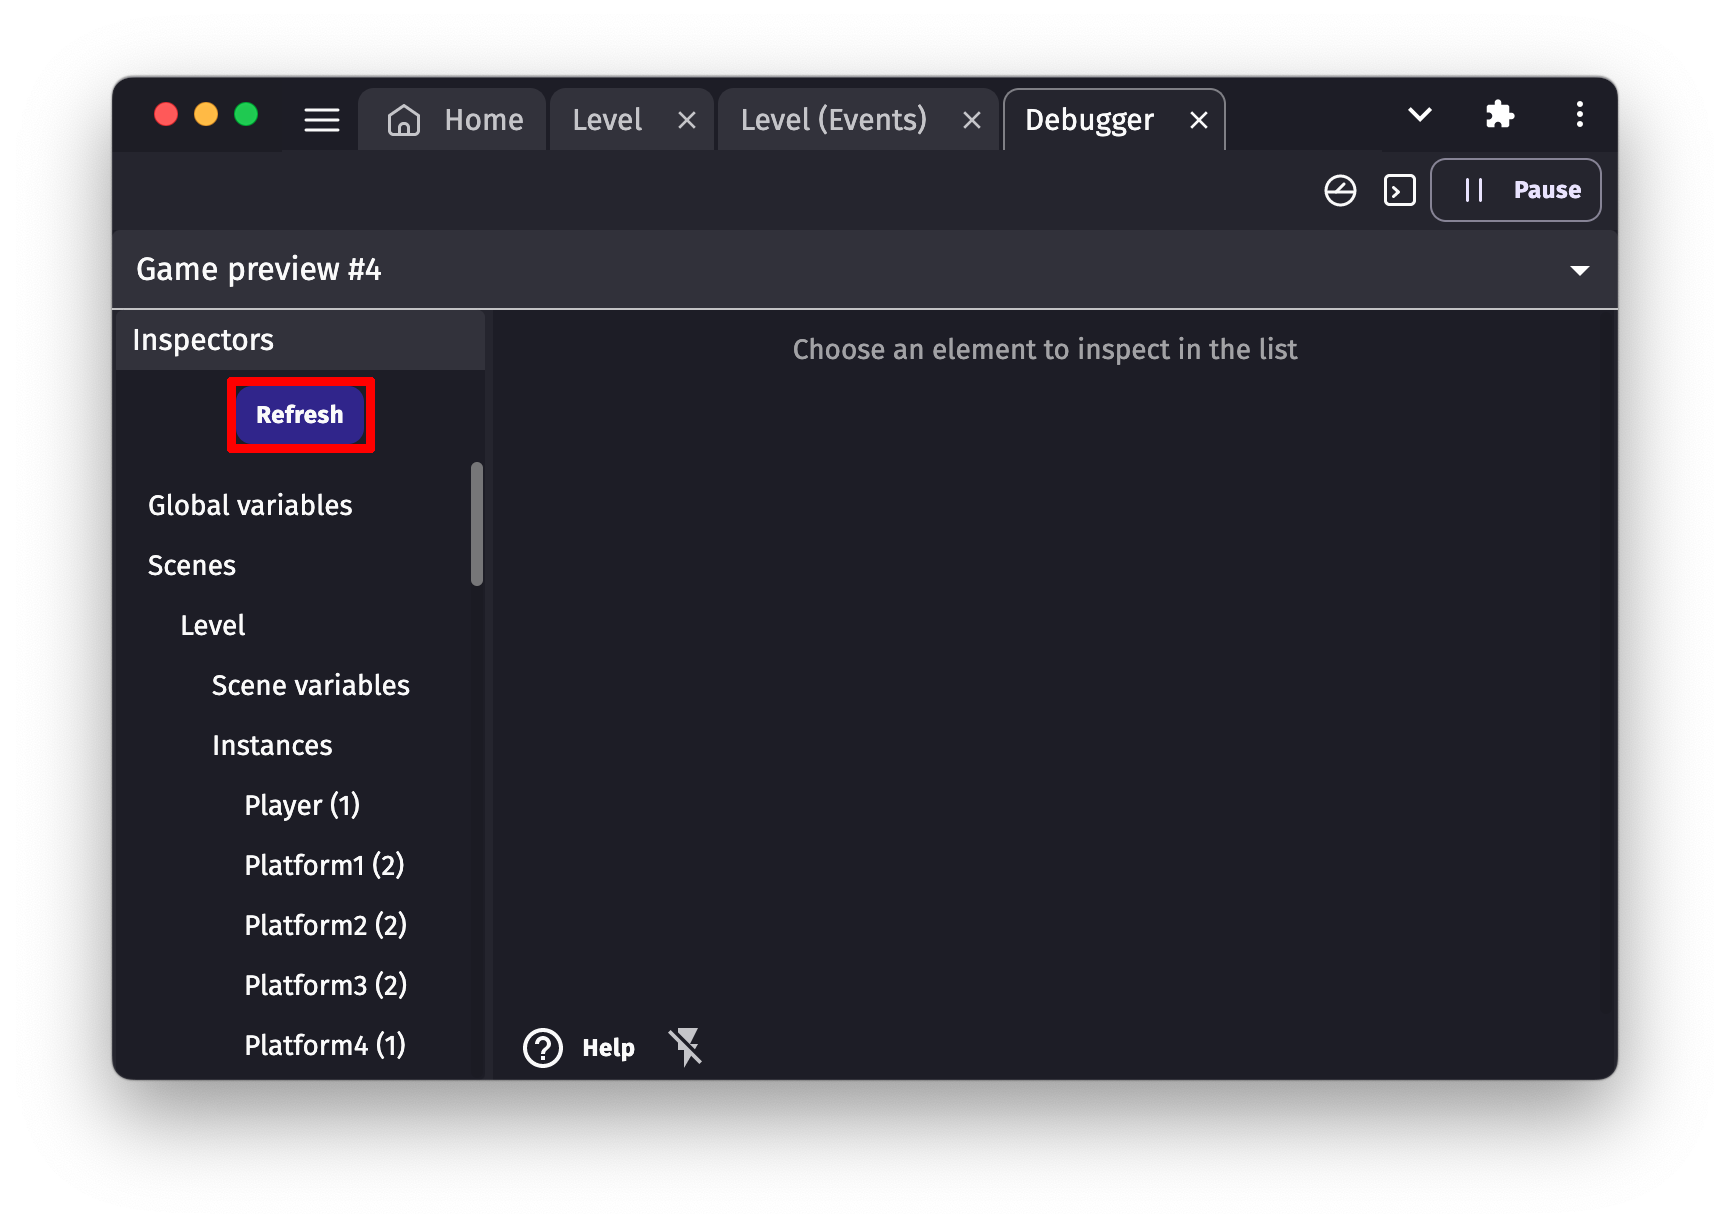
Click on "Refresh" at any time to fetch the data of the game:
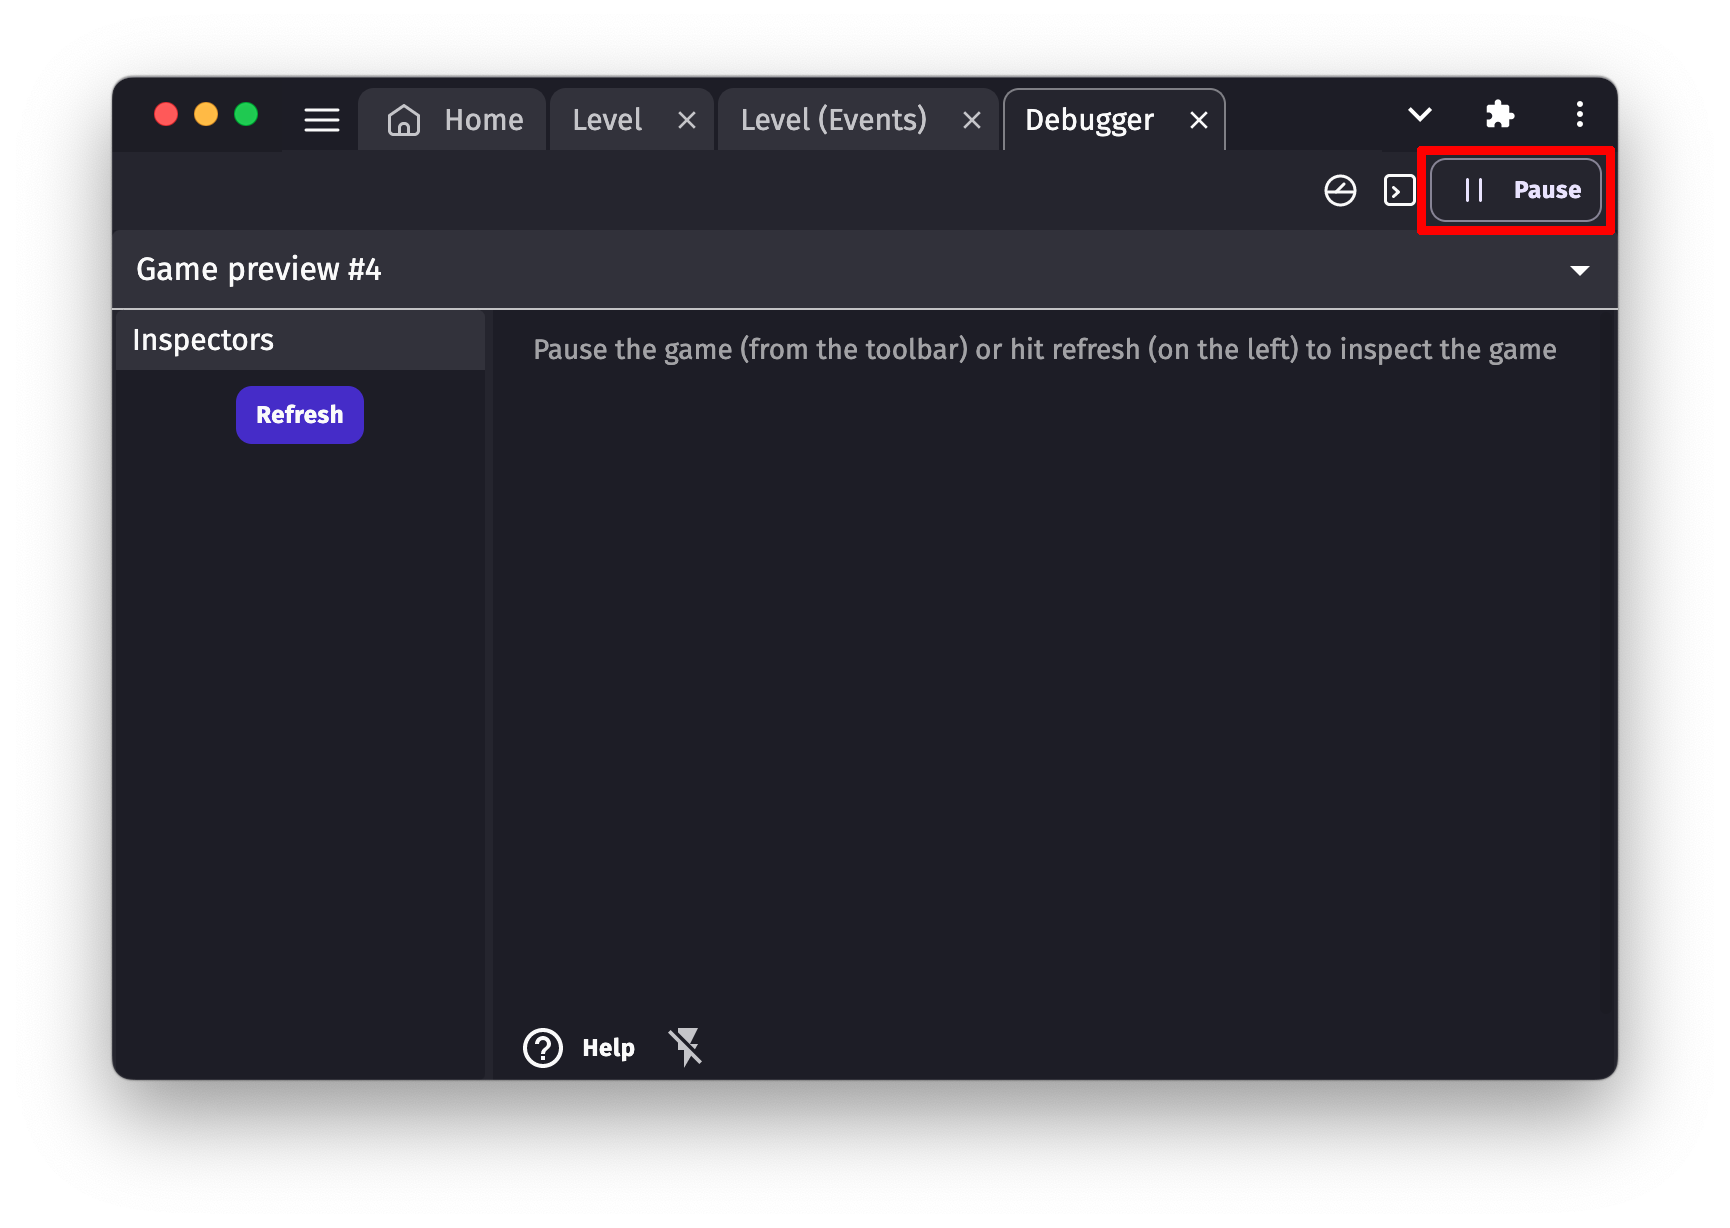
You can also use the Pause button in the toolbar:
Inspect the scenes of the game
The scenes that are currently running are listed below the Scenes item in the Debugger. If you click on the name of a scene, it will be displayed in the inspector on the right. The inspector now contains the layers of that scene and a button to create a new instance of an object in that scene.
Create a new instance on the scene
To create a new instance, click on the name of the scene where you want to create the instance. Write the name of the object and click on Create:
The instance will be created at position 0;0, on the base layer with a Z-order of 0. You can then find it in the list of instances and change its position, angle, layer, etc.
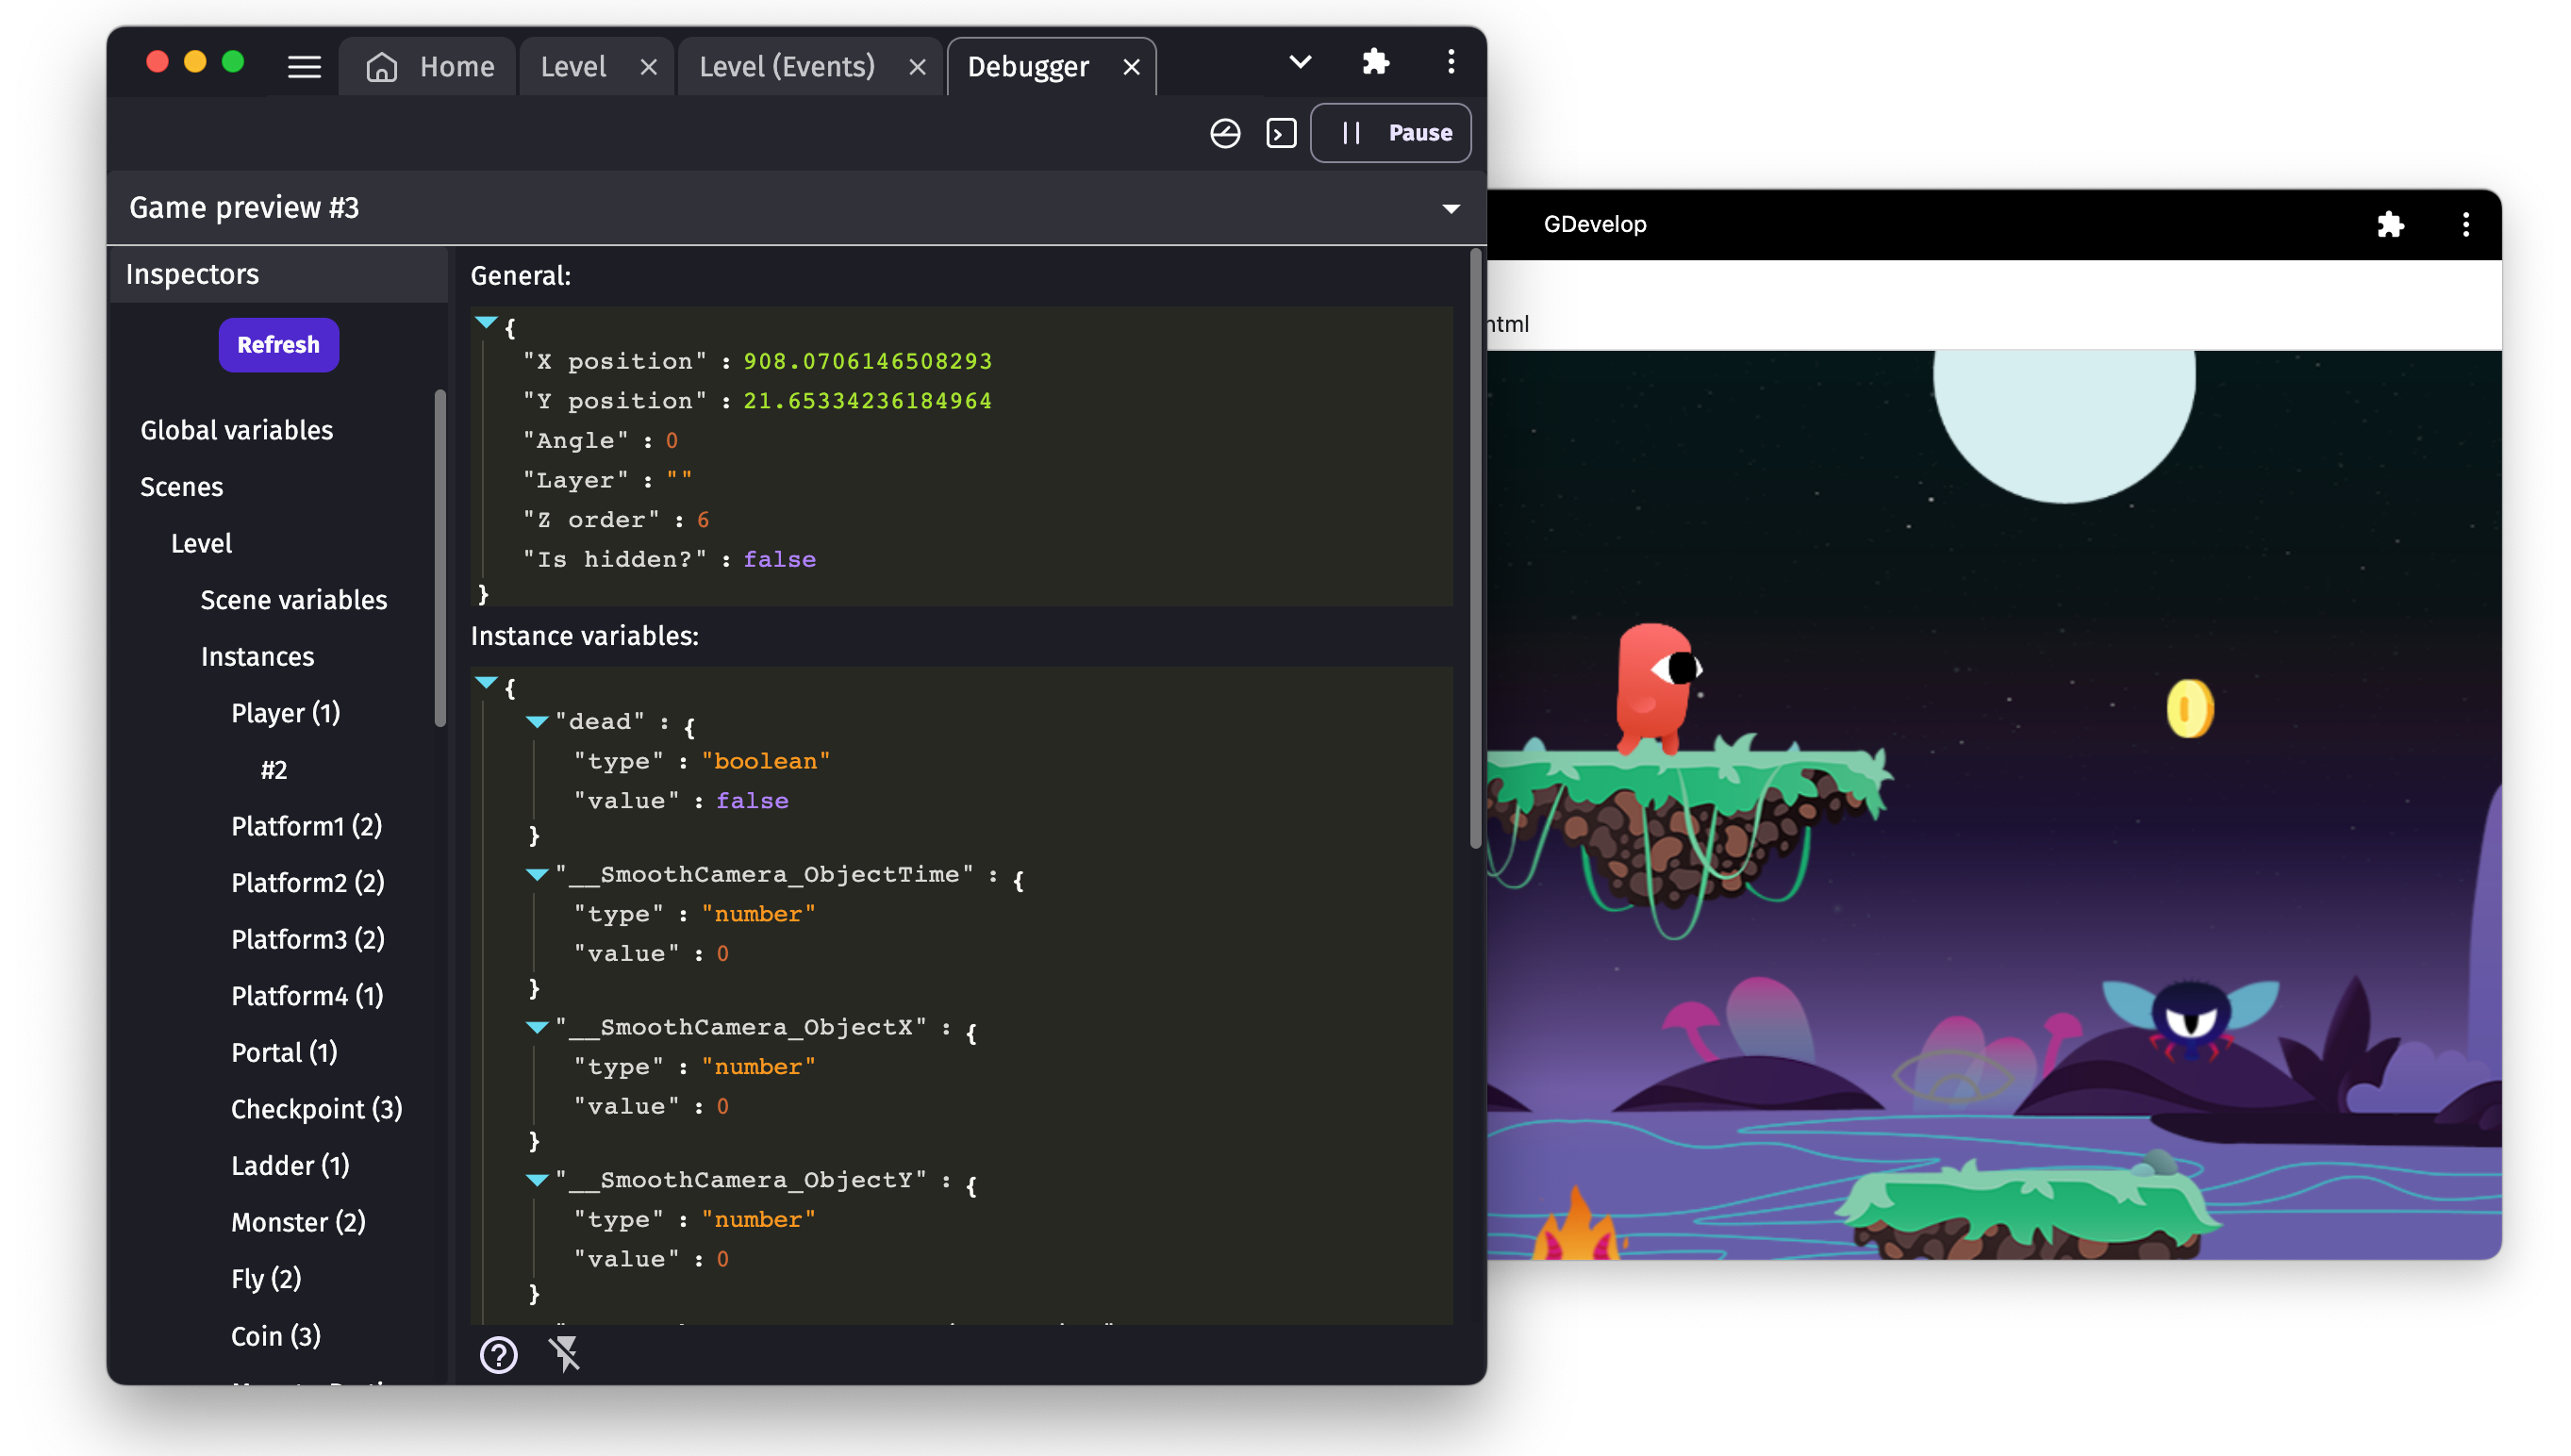
Inspect and edit the instances
In the list, you can find Instances of every running scene. Instances are grouped by objects name. Click on an object name to see the list of instances of this object living on the scene. Click on an instance number (each instance has a unique number) to inspect it:
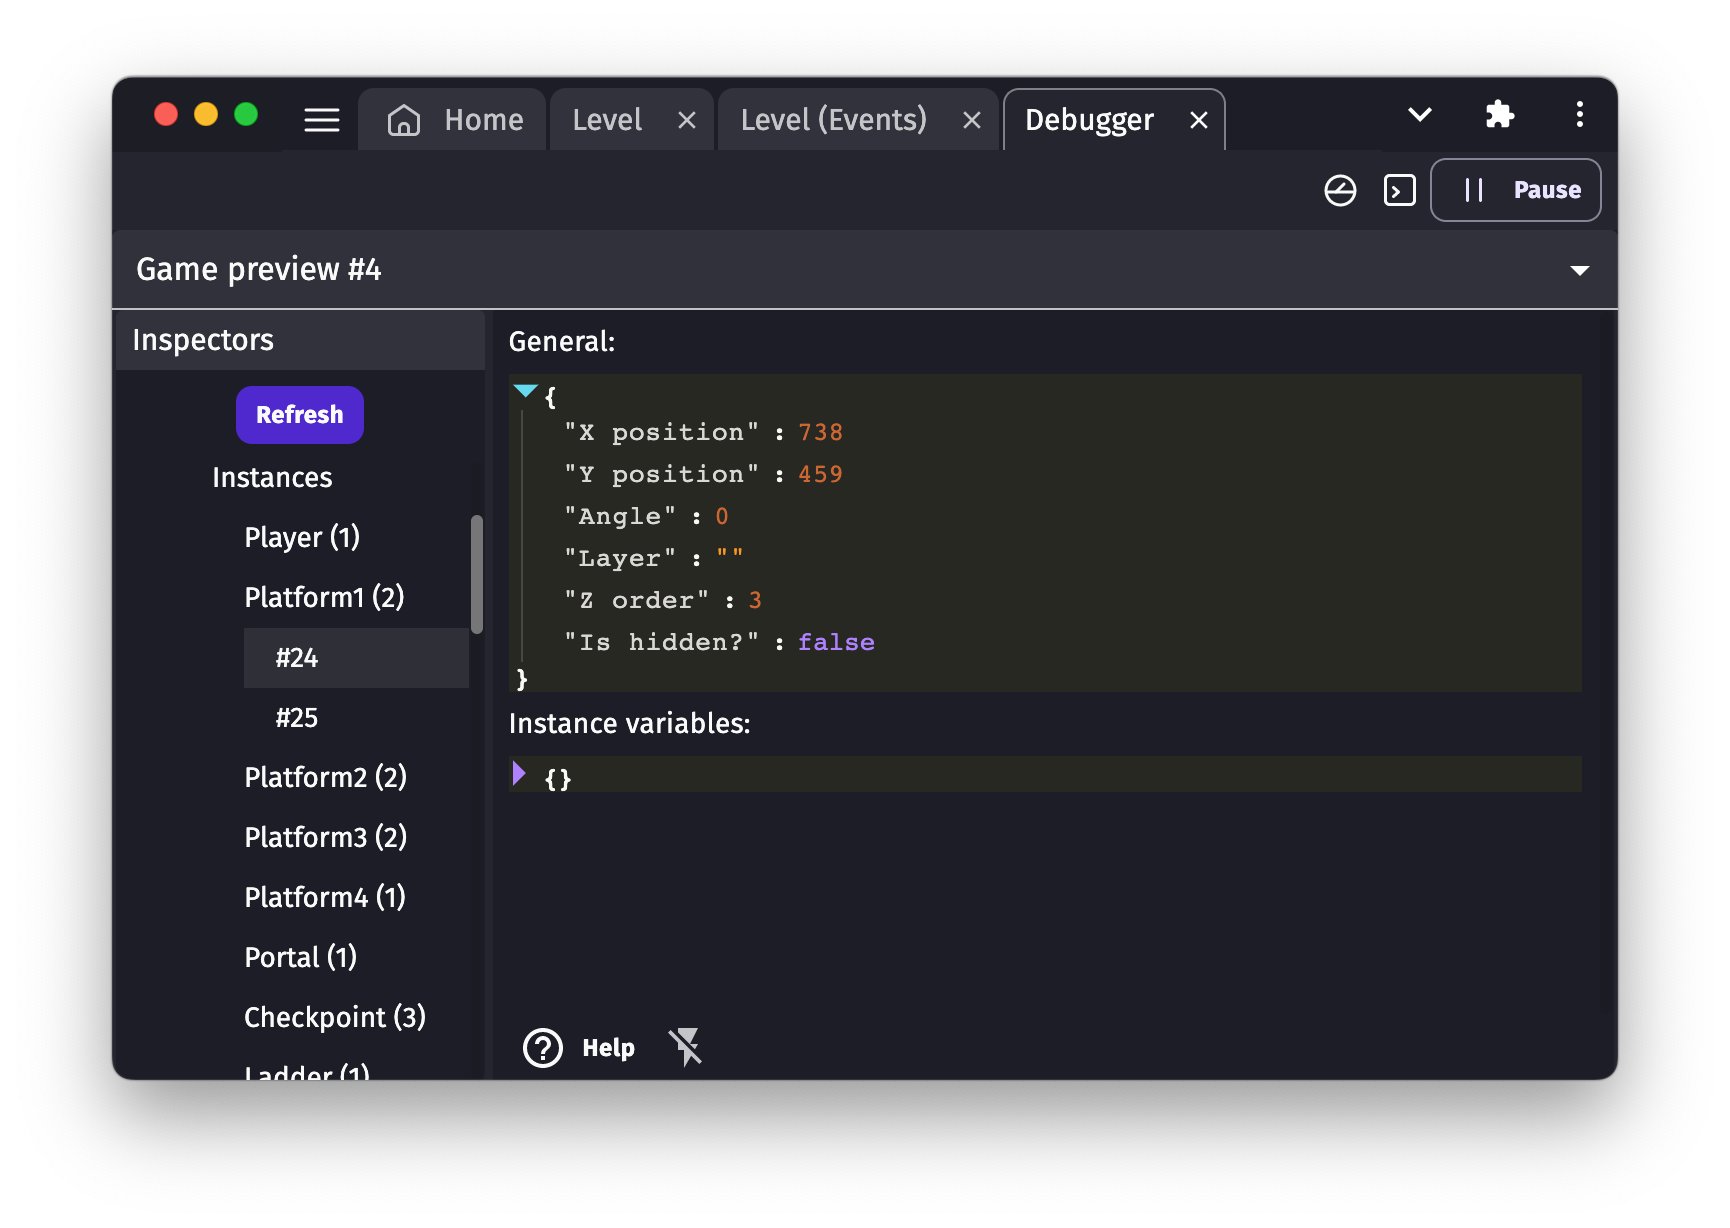
The inspector shows general properties of the instance, for example, position, angle, layer, etc. For each of these properties, you can edit them by clicking on the value:
Validate your changes by clicking on the small validate button (the one with the tick icon).
You can also see the variables of the instance and modify them (see below for more information about variables).
Inspect and edit the variables
You can inspect variables of the game (global variables), of a scene (scene variables), or of a particular instance of an object (instance variables).
To do this, in the list, click on Global Variables, Scene variables, or the instance number that you want to inspect.
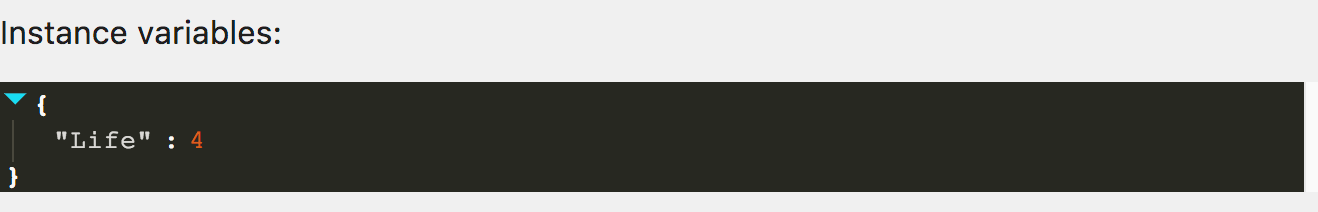
Variables will be shown in a list showing variable names and values (either a number or a text). Here is an example of an instance of an object having a "Life" variable:
Like other fields, you can click on the value of the variable to change it. It's a good way to see how your game is behaving according to the value of variables and test that your events are working properly.
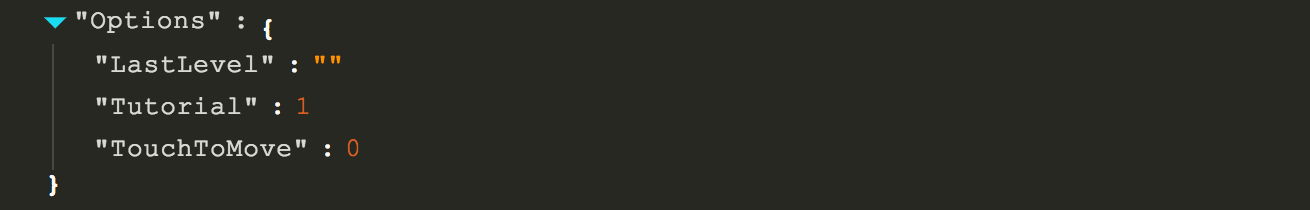
Variables can also be structures, meaning that they hold other variables. In this case, instead of seeing the value (number or text) of the variable, you will see a sub-list containing the children variables:
Here is an example of a variable named "Options", containing children variables to store the options of a game:
You can also change the value of the children variables like any other.
Profile the performance of your game.
The Profiler is a tool that measures the time spent on different aspects of your game while it is running. It then shows a breakdown of each section, including events. Read more about using the profiler.